Illustrations
Fusion Diagrams
These are diagrams produced during the annotate step. These represent the putative fusion events of a single breakpoint pair.

Fusion from transcriptome data. Intronic breakpoints here indicate retained intron sequence and a novel exon is predicted.
If the [draw_fusions_only](../../configuration/settings/#draw_fusions_only flag is set to False then all events will produce a diagram, even anti-sense fusions

Disruptive Anti-sense Fusion
Transcript Overlays
MAVIS supports generating diagrams of all transcripts for a given gene. These can be overlaid with markers and bam_file pileup data. This is particularly useful for visualizing splice site mutations.
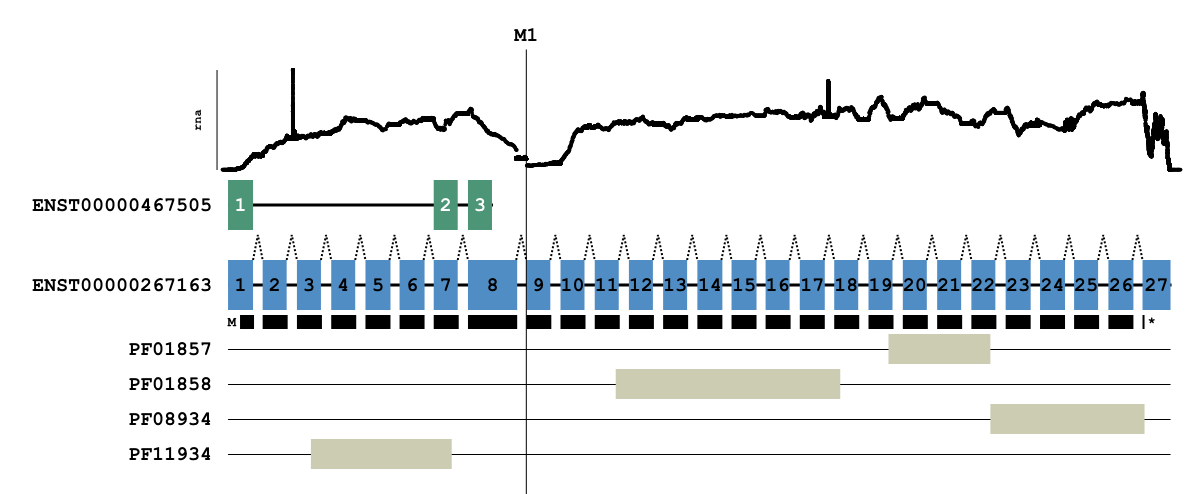
RB1 splice site mutation results in skipping of exon 9
The above diagram was generated using the overlay command
mavis overlay RB1 \
    -o /path/to/output/dir \
    --read_depth_plot rna /path/to/bam/file \
    --marker M1 48939029 \
    --annotations /path/to/mavis/annotations/reference/file